CLEF Viewer: a lightweight self-hosted viewer for CLEF logs

The CLEF Viewer is a lightweight, self-hosted webapp for receiving, storing, and visualizing structured logs in the CLEF format (compatible with Seq). It was created as a natural complement to structured_logger for developers who need observability in development and small production environments without depending on a full Seq instance.
Why a CLEF viewer?
Many Flutter/Dart projects rely on print or loose log statements. As an app grows, you need:
- Search and filtering by level, device, and properties
- Real-time visualization
- Grouping (by screen, error, user, etc.)
- CLEF export for later analysis or migration
- Bounded storage (no uncontrolled growth)
The CLEF Viewer solves this in a simple way: a Dart VM server + Flutter Web UI, all packaged in two lightweight Docker images.
It uses the same default port as Seq (5341), so you only need to change the URL in SinkSeq.
Overall architecture
The server serves both the API and the static UI assets in production (via shelf_static).
Event ingest flow
SinkSeq (and any CLEF client) sends events to the server.
The parser supports both the classic Seq endpoint (/api/events/raw?clef) and the modern one (/ingest/clef with NDJSON).
Storage model (SQLite)
A simple and efficient table:
Indexes on: timestamp, level, device_id, event_id.
FIFO rotation: when the number of rows exceeds MAX_ROWS (default 100k), the repository automatically deletes the oldest entries.
Database size is exposed in the Admin UI via stat on the .db file.
Real-time visualization — Viewer
The Viewer tab is where you will spend most of your time:
- Event table with
LevelBadgeand rendered messages (uses@mor fills the template client-side with highlighted values) - Rich filters: level, time range, device id, property filters (with editable active chips)
- Grouping (GroupPanel): by level, hour, device, or any custom property
- Resizable split pane (table × groups)
- Live updates via SSE (
/api/events/stream): new events appear automatically at the top of the table (with a 3s polling fallback if the proxy blocks SSE) - Export and actions respect the shared active filter between Viewer and Admin
Here is the Viewer interface in action (real screenshot):
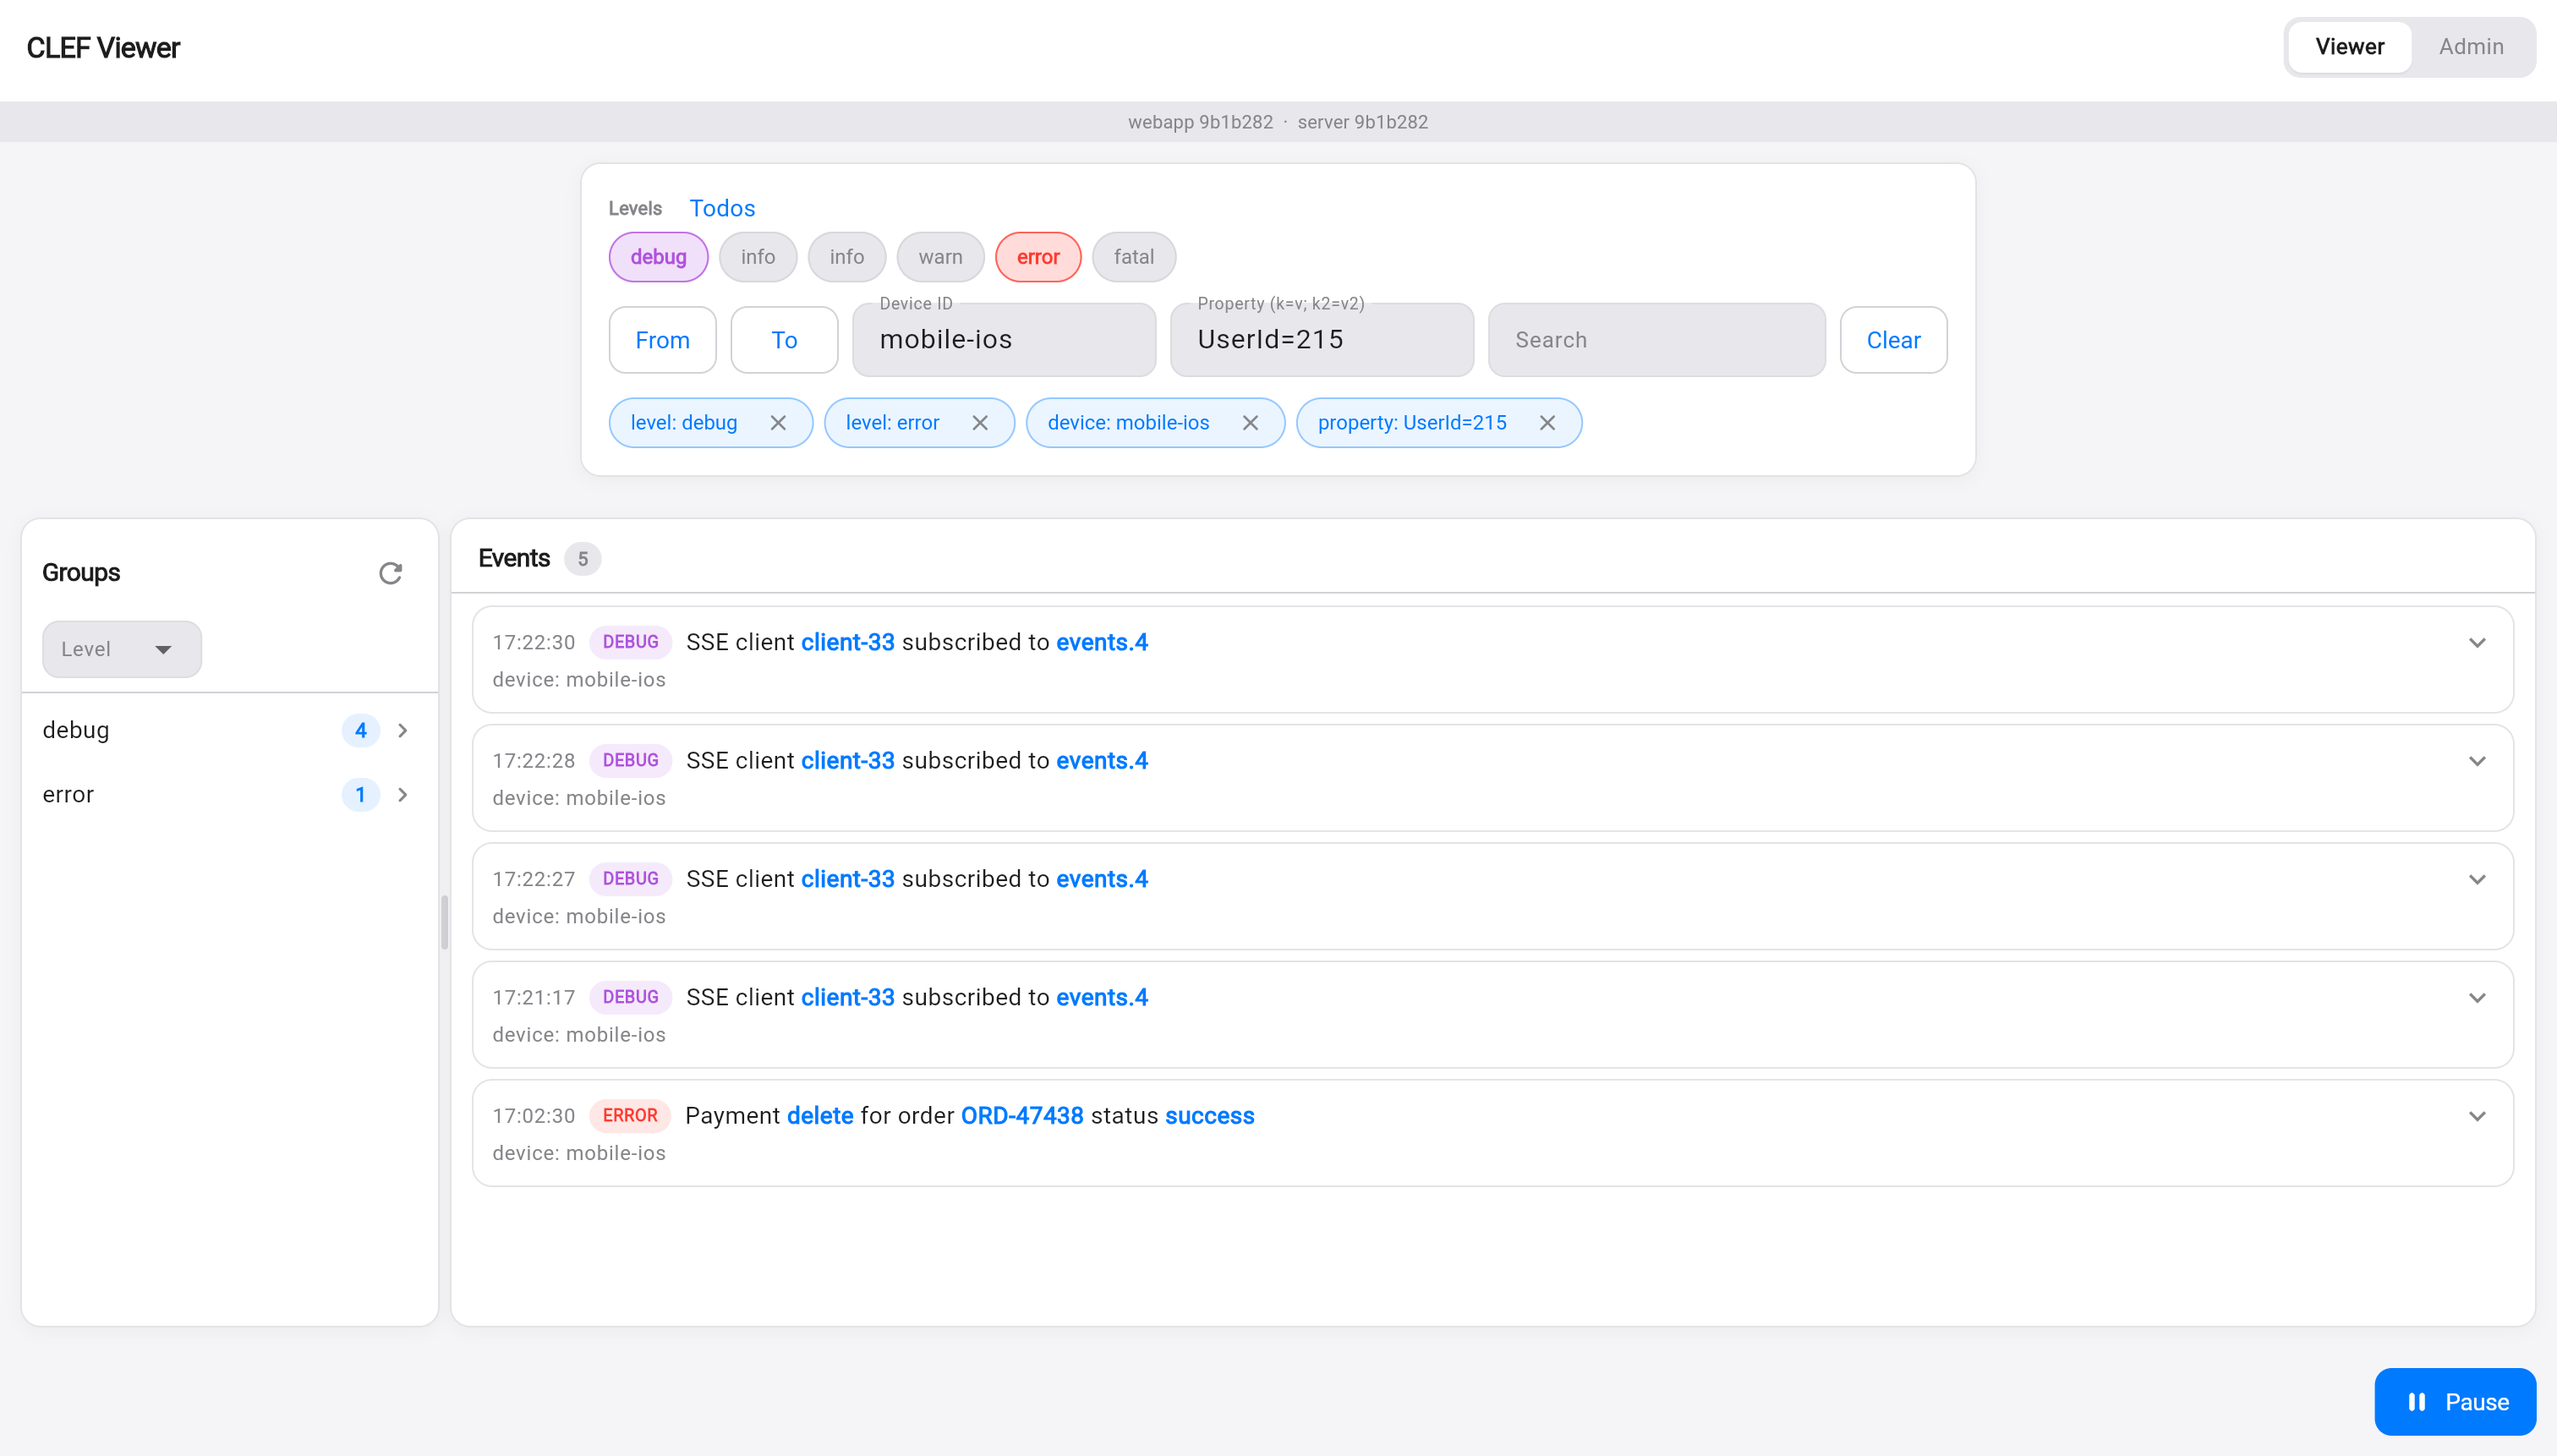
Elements visible in the Viewer screenshot:
- Header with Viewer (active) | Admin tabs + short build versions (
webapp 9b1b282 · server 9b1b282) - Top filter bar:
- Levels pills (All + debug selected in purple, error in red, etc.)
- From / To date fields
- Device ID:
mobile-ios - Property (key=value):
UserId=215 - Search and Clear buttons
- Active filter chips right below (blue and removable):
level: debug,level: error,device: mobile-ios,property: UserId=215 - Split layout:
- Left sidebar Groups (grouped by Level): debug (4), error (1) with arrows
- Main Events area (counter "5"):
- Log rows with timestamp, level badge (purple for DEBUG, red for ERROR)
- Message with blue highlights on dynamic values (e.g.
client-33,events.4,delete,success) - Sub-line
device: mobile-ios - Chevrons to expand each event
- Blue Pause button (bottom right) to pause the real-time stream
The blue highlights in the messages (e.g. client-33, delete, success) are generated by the DisplayMessageText component: it takes the event's messageTemplate and substitutes the placeholders with values from properties, visually highlighting each substituted value.
This screenshot perfectly demonstrates:
- Combined filters (level + device + property)
- Visual active filter chips (ActiveFilterChips)
- Real-time updated grouping on the side (GroupPanel)
- Rich message template rendering
- Events arriving via SSE (multiple "SSE client ... subscribed")
Admin panel and reports
The Admin tab (protected by ADMIN_API_KEY via the X-Seq-ApiKey header) shows:
- Storage: database file size + total events
- Reports:
- Logs/sec (last minute and average of the last hour)
- Total by period (last 24h, grouped by hour) — horizontal bars
- Ingest peaks (top 10 minutes in the last 24h)
- Actions: Export All CLEF / Export Filtered CLEF (compatible NDJSON), Clear All / Clear Filtered
The API key is stored only in the browser's sessionStorage (never in the URL).
Here is the Admin interface in production (real screenshot):
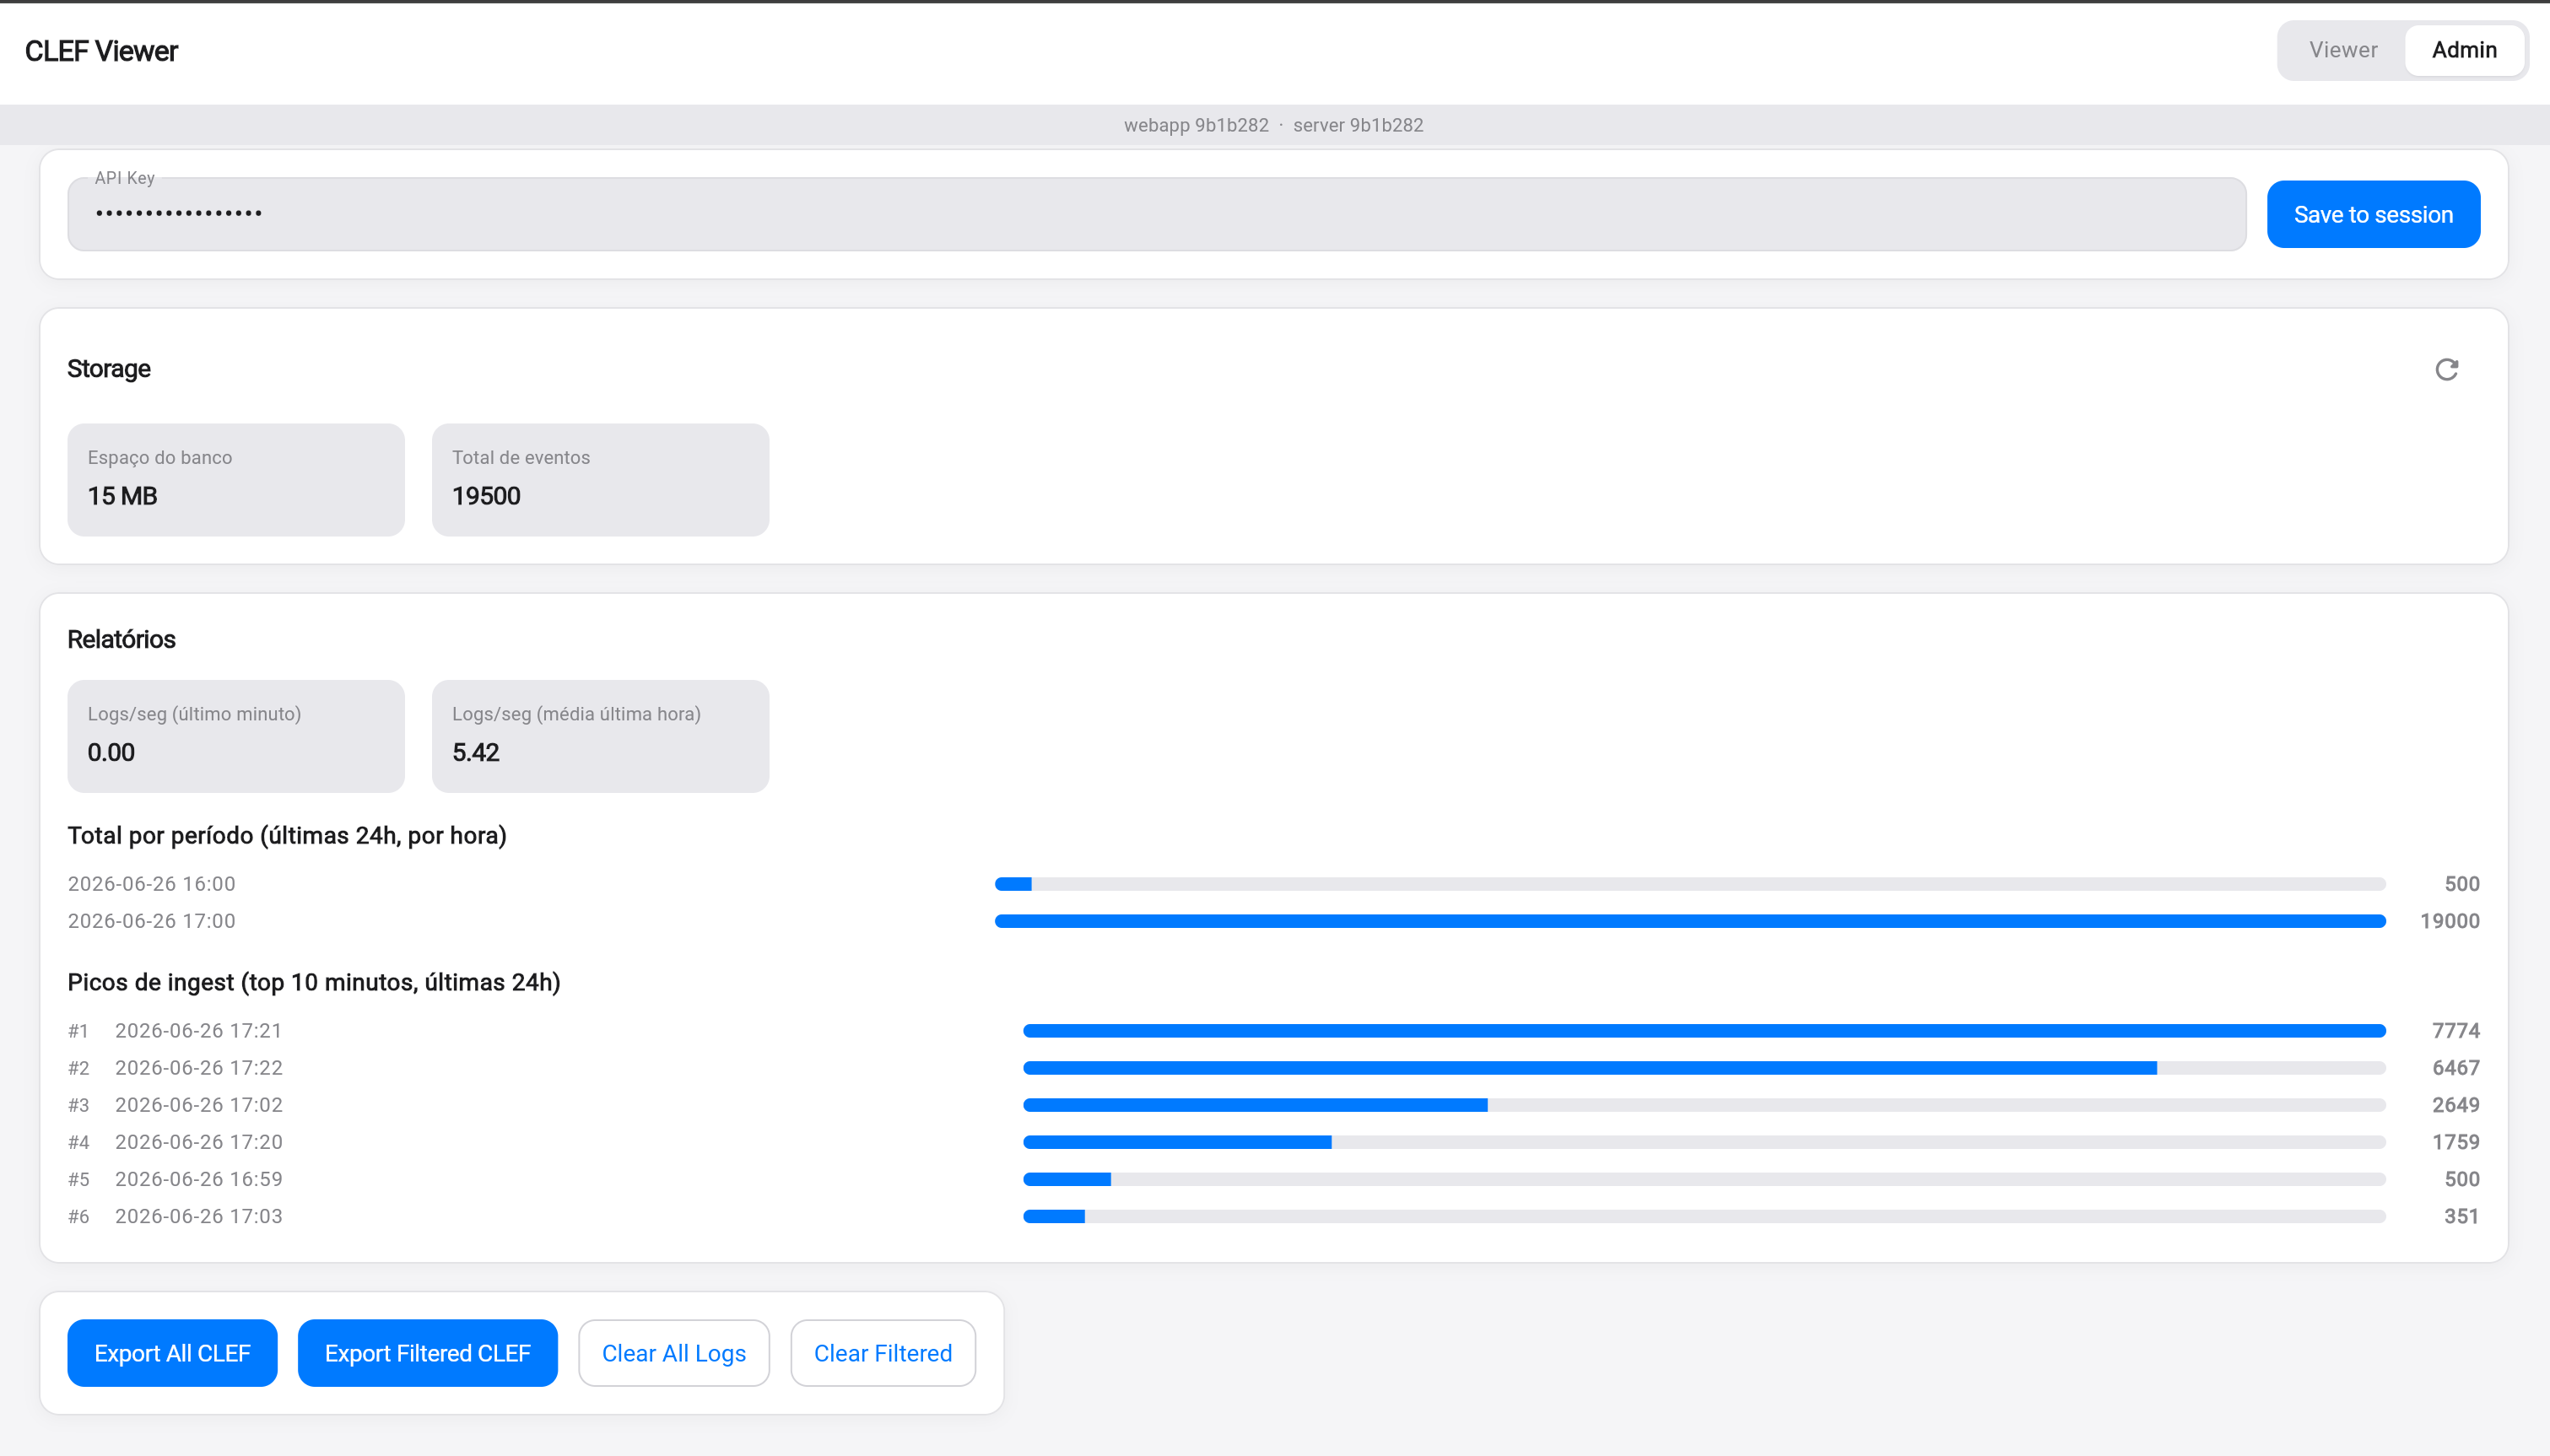
Elements of the Admin screen:
- Header with Viewer | Admin tabs (top right) + short build versions (
webapp 9b1b282 · server 9b1b282) - API Key field (masked values) + blue Save to session button (the key is stored only in the browser's
sessionStorage) - Storage card:
- "Database size 15 MB"
- "Total events 19500"
- Reports card:
- Logs/sec (last minute):
0.00 - Logs/sec (average last hour):
5.42
- Logs/sec (last minute):
- Total by period (last 24h, per hour) — blue horizontal bars with timestamps and counts (e.g.: 2026-06-26 16:00 … 19000)
- Ingest peaks (top 10 minutes, last 24h) — ranked list (#1 2026-06-26 17:21 → 7774, #2 17:22 → 6467, etc.)
- Action row: Export All CLEF and Export Filtered CLEF (primary blue buttons) + Clear All Logs / Clear Filtered (secondary)
The shared active filter between Viewer and Admin means that "Export Filtered" and "Clear Filtered" use exactly the same query you see in the log table.
Both screenshots (Viewer and Admin) are included based on the real prints provided. The Mermaid diagrams complement them by explaining the architecture behind the UI.
The calculations are performed on the server (countSince, countByHour, ingestPeaks) and sent as JSON.
Deployment and Docker
Two independent services:
| Service | Image | Port | Purpose |
|---|---|---|---|
server | ghcr.io/altamir/clef-viewer-server | 5341 | API + ingest + SSE + SQLite |
webapp | ghcr.io/altamir/clef-viewer-webapp | 80 (nginx) | Flutter Web UI + reverse proxy for /api and /ingest |
In production (e.g. Hostinger VPS + Docker Manager + Traefik + Let's Encrypt):
- Images are published automatically by CI on every change under
apps/clef_viewer/ - Just set
ADMIN_API_KEY, the hosts, and deploy the compose file
Local development is simple:
# Server
cd apps/clef_viewer/server
DEV_MODE=true dart run bin/server.dart

# UI (another terminal)
cd ../ui
flutter run -d chrome --dart-define=CLEF_VIEWER_API=http://localhost:5341
Or use the provided docker-compose.*.yml files.
Integration with structured_logger
No extra code is required in the logger:
import 'package:structured_logger/structured_logger.dart';
import 'dart:io';

final logger = StructureLogger()
  ..addSink(SinkSeq(
    'https://clef-ingest.altamir.dev',
    apiKey: Platform.environment['INGEST_API_KEY'],
    deviceIdentifier: 'my-production-app',
  ));

await logger.info('User {userId} viewed {screen}', data: {
  'userId': 42,
  'screen': 'Checkout',
});
The event appears in the UI in less than 1s via SSE.
Summary
CLEF Viewer delivers a Seq-like experience for lightweight use cases:
- Native CLEF ingest (works with SinkSeq and other Serilog-style clients)
- Real-time + historical + grouping
- Practical Admin panel with export and cleanup
- Bounded and predictable storage
- Easy to run locally or on a VPS with Docker
- 100% inside the pure-Dart monorepo
It closes the loop: you emit with structured_logger → visualize instantly in CLEF Viewer → export when you need more power.
Try it:
git clone https://github.com/Altamir/structured_logger
cd apps/clef_viewer
# follow the README
Want to contribute? Issues and PRs are welcome — especially filter improvements, more chart types, and support for additional sinks in the viewer.
Thanks to everyone already using it in production! Feedback is always welcome.